This is the second article in the Statistics series; here is the link to the first one.
After Collection and Classification, the next step is to analyze the data to explore its properties. The tools that are used to describe the properties of data are known as Descriptive Statistics. Descriptive Statistics analyses three major properties that describe the data.
1. Central Tendency
2. Dispersion
3. Skewness and Kurtosis
Central Tendency denotes a property of a central value (average) around which most numerical values tend to concentrate or group. The term average in Statistics means one figure summary of a distribution. It gives us a single value from the mass of data to provide an idea about the entire data. E.g. It is impossible to remember the ages of all students in the class, but if we calculate the average age, then we get a single value representing the entire class.
Different measures of Central Tendency;
- Mean (Arithmetic/Geometric/Harmonic)
- Median
- Mode
Dispersion shows the degree to which numerical values are scattered or dispersed around the central value. Measures of Central Tendency are not enough to understand the data because they don’t give any idea about the spread or variability in the data. We will understand this by example. Observations of group ‘A’: 20, 50 and 80 and observations of group ‘B’: 48, 50 and 52 have the same mean of 50, but variability is higher in group ‘A’ because the observations are far from each other in group ‘A’ than in group ‘B’.
Different measures of Dispersion;
- Range
- Quartile Deviation
- Mean Deviation
- Standard Deviation and Variance
Skewness and Kurtosis: Besides Central Tendency (related to the location of the distribution) and dispersion (related to the scale of distribution), it is also essential to understand the shape of the distribution.

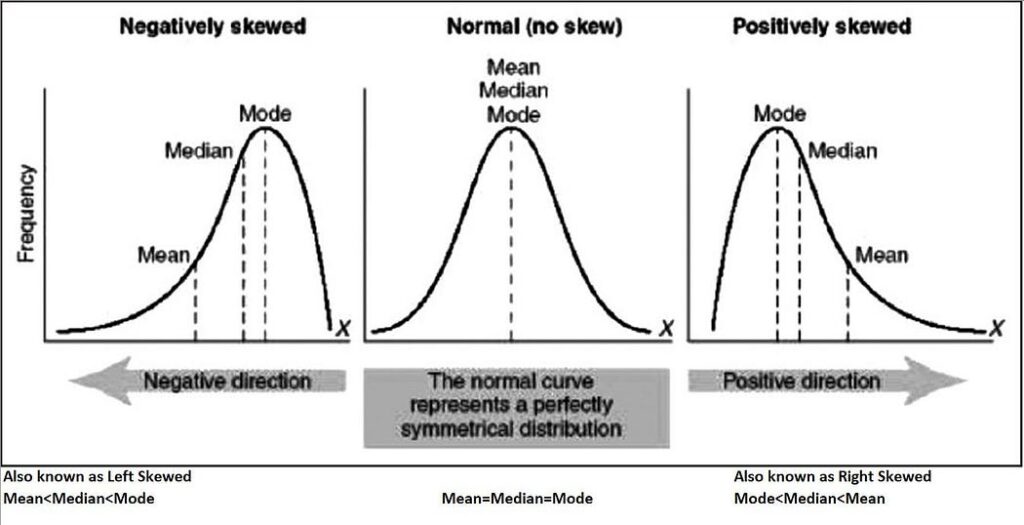
Skewness represents lack of symmetry. In Maths, a figure is symmetric if there exists a point through which, on drawing a perpendicular on the X-axis, it divides the figure into two congruent parts. Similarly, in Statistics, the distribution of data is called symmetric if the mean, median, and mode coincide. Else distribution becomes asymmetric. So measures of skewness help us to know what degree and in which direction the distribution has a departure from symmetry.

Kurtosis gives the idea of the flatness or peakedness of a distribution. The degree of kurtosis of a distribution is measured relative to that of a normal curve. The curve with greater peakedness than the normal curve is called “Leptokurtic”. The curve which is flatter than the normal curve is called “Platykurtic”. The normal curve is called “Mesokurtic.”
#Statistics #AppliedStatistics #DescriptiveStatistics #DataAnalysis #StatisticalAnalysis #DataVisualization #StatisticalMethods #DataMetrics #DataInterpretation #Mathematics #DataInsights #DataScience